2: Impedance - frequency curves
(1 + jω/ω0)

I now want to look more closely at the term (1 + jω/ω0) which dominates the expressions for the impedance of both the series and the parallel RC networks:
Series: ZS = R [1 + (jω/ω0)] / (jω/ω0)

Parallel: ZP = R / [1 + (jω/ω0)]
In other words, the impedance of R and C in combination is the impedance of R, modified by a factor which depends only on (jω/ω0). Of course, ZS and ZP could equally well have been expressed in terms of (1/jωC) and some other factor. But impedance is measured in ohms, after all, and an impedance is just a special kind of resistor. Instead of being flat straight lines, the magnitude and phase of a complex impedance are twisted into their characteristic shapes by the presence of the (1 + jω/ω0) factor.
Now (1 + jω/ω0) is a dimensionless number. It is evidently complex - that is, it possesses both a real and an imaginary part. This means it contains information on both magnitude and phase. Before we can predict the networks' behaviour we need to understand how both these quantities vary with frequency.
The trouble is, there are no constraints on the signal frequency: ω could be anywhere between dc and light! It is easy enough to find the limiting values of (1 + jω/ω0) though, so I may as well start with them.
Consider first what happens when ω is very small. At very low frequencies the (j) term becomes negligible and so
(1 + jω/ω0) ≈ 1, near enough.
The magnitude is unity, and the phase shift is zero.
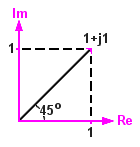
Next, suppose ω is exactly ω0. At this frequency (the network's characteristic frequency)
(1 + jω/ω0) = 1 + j
Visualising the vector triangle, we can say with confidence that when ω=ω0 the magnitude is √[2] and the phase shift is arctan[1] or +45°.
Lastly, suppose that ω is enormous. At very high frequencies,
(1 + jω/ω0) ≈ j * (infinity), or thereabouts.
The magnitude is very large, and the phase shift is +90°.
The value of logarithmic plots
When dealing with quantities which vary with frequency, the best way to see what's going on is to use a graph. The difficult bit is putting the information into graphical form in a way that does not over-emphasize parts of it at the expense of others.

Think for a moment about the impedance of a capacitor:
Z = 1 / (jωC)
I can separate the impedance into its two constituent parts, magnitude and phase, by writing it as a complex number (I just multiply the top and bottom by j) to get
Z = 0 - j (1/ωC)
|Z| = √[ Real2 + Imaginary2 ] = √[ 02 + (-1/ωC)2] = 1 / (ωC)
Φ = arctan [ Imaginary / Real ] = arctan [ (-1/ωC) / 0] = arctan [ -∞ ] = -90 degrees
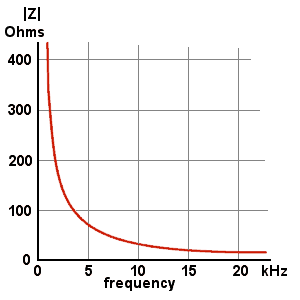
Obviously enough, as ω tends to zero, |Z| tends to infinity, and vice versa. I could graph the magnitude of |Z| for a 470 nF capacitor like this.
But the graph doesn't tell me much more than I knew already.
Worse, it implies, quite wrongly, that at frequencies above 20 kHz the impedance is almost constant, and at frequencies below about 1 kHz the impedance is changing too fast to measure. This is nonsense. And a graph that misleads so badly is downright dangerous.
It's also difficult to sketch accurately, and I won't be using it. There's a much simpler and clearer way to illustrate what's going on.
Suppose I convert the |Z| equation to logarithmic form, by taking the logs of both sides:
LOG (|Z|) = LOG (1 / ωC) = LOG (1/C) - LOG (ω)
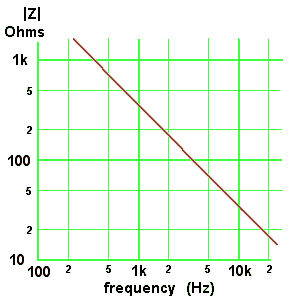
This is a linear equation. It has the same form as
y = (constant) - x
and when plotted on logarithmic paper it gives a straight-line graph.
This is much better. It expresses clearly that a tenfold increase in frequency implies a tenfold decrease in |Z|. If I need to know |Z| at some frequency not shown on the graph - 50 Hz, say - I can easily infer it from the value of |Z| at a frequency that is plotted. At 500 Hz |Z| for a 470 nF capacitor is about 700 ohms, so at 5 kHz it will be about 70 ohms.
There is another good reason for using logarithmic plots. Provided I can write the expression for some unknown |Z| in the form
|Z| = A / B
then I can sketch its response (on log paper) as the sum of its individual terms, because
LOG (|Z|) = LOG (A) - LOG (B)
... and it will emerge that this is quite a useful trick.
Approximating the response
Now I can try to sketch what (1 + jω/ω0) looks like.
The frequency-dependent variable is not just ω by itself. It is the ratio of ω to the network's characteristic frequency ω0. So instead of saying "when ω is very small", I should actually be saying "when ω is very much less than ω0". This minor change is enormously helpful, because it allows me to chop up the frequency range into three blocks:
- frequencies well below ω0,
- frequencies near ω0, and
- frequencies well above ω0,
and think separately about each in turn. What does "very much less than" mean? My view is that if an error makes less than 10% difference to the answer I can probably live with it. So I shall assume for now that "very much less" means "not more than one tenth as big". Similarly, "very much greater" means "at least ten times bigger". It becomes possible at a stroke to ignore all but two decades of frequency with the comforting knowledge that, although my answer will be wrong, it probably won't be wrong by much. Nothing saves quite so much hard work as a judiciously applied approximation.
Whilst it is true to say that (1 + jω/ω0) becomes "very large" when ω is much larger than ω0, it isn't terribly helpful. How large is "very large"? But if we say instead that when ω >> ω0
(1 + jω/ω0) ==> (jω/ω0)
we see that at high frequencies, when (ω/ω0) >> 1, (1 + jω/ω0) becomes proportional to ω and contains a j. This approximation makes it possible to sketch the shape of both the magnitude and phase responses at high frequencies.
At low frequencies, when (ω/ω0) << 1,
(1 + jω/ω0) ==> 1.
The magnitude is constant at 1, and the phase shift is zero.
These approximations become more-or-less true at (ω/ω0) = 0.1 or less and (ω/ω0) = 10 or more. Each is a decade (a factor of ten) away from ω0. There is no reason to suppose that one is more important than the other, so it makes sense to use a logarithmic frequency axis for the graph, so each decade is the same size. The magnitude axis should then also be logarithmic so that the graph at high frequencies - where the magnitude is proportional to ω - can be just a straight line.
.gif)
Between ω = 0.1ω0 and ω = 10ω0 the approximations are not valid. The broken lines in these graphs are no more than a guess at the actual response at frequencies near ω0. We can see however from the vector triangle that the magnitude at ω = ω0 is √[2] and not 1.
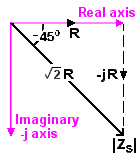
The approximations are stretched furthest near ω = ω0.
As ω gets either bigger or smaller the approximations become more nearly true. But the actual magnitude at ω0 (shown as a cross on the sketch) is encouragingly close to where the broken lines intersect, so it looks as though I am on the right track.
What's more, the vector triangle shows that the phase shift is +45° at ω = ω0, exactly where the approximation puts it.
The frequency ω0 is evidently the frequency at which the magnitude changes its slope. For this reason it is often called the corner frequency or break frequency of the network.
Approximate response of series network

We found that the series circuit has an impedance
Series: ZS = R [ 1 + (jω/ω0) ] / (jω/ω0)
This can be drawn (on log-log paper) by first sketching the (1 + jω/ω0) term and then subtracting the (jω/ω0) term from it, because
log (top/bottom) = log(top) - log(bottom).
The operation is not as difficult as it sounds. Consider first the magnitude graph. The (1 + jω/ω0) term is only two straight lines. For ω << ω0 the line has a slope of 0 (that is, it's horizontal) and for ω >> ω0 it has a slope of 1 (a 10x increase in ω gives a 10x increase in magnitude). The (jω/ω0) term has a constant slope of 1, just like the (1 + jω/ω0) term at high frequencies. So all I have to do is subtract the slopes, like this:

- when ω << ω0, the slope becomes 0 - 1 = -1,
- when ω >> ω0, the slope becomes 1 - 1 = 0.
The only other thing I need to know is, when the slope is zero - that is, when the line is horizontal - what is the magnitude? The slope is zero when ω >> ω0. At these high frequencies (1 + jω/ω0) is very nearly just jω/ω0 and so
ZS = R [ jω/ω0 / jω/ω0 ] = R
It seems somehow unnatural to think of the log of an impedance, but fortunately there is a way round this. The results can be expressed in dB. Often, dB is used to express a voltage ratio - for example, the gain of an amplifier - but really it's more general than this. We could write:
|Z1| / |Z2| = 20 LOG (|Z1| / |Z2|) (dB)
We want to plot just |ZS|, and you may be wondering what we could possibly use for the other |Z|. But remember that impedance is a function of frequency. The magnitudes |Z1| and |Z2| can be two different values of |ZS| at two different frequencies, ω1 and ω2. Then, provided I choose a value of |ZS| to use as a reference - which implies that I must choose a reference frequency - I can express |ZS| at any other frequency in terms of its value at the reference frequency. Which frequency I choose as reference will depend on the network I am examining. In the case of the simple series network, I know that |ZS| gets closer and closer to R as ω gets bigger and bigger, so choosing ω = ∞ seems like a good idea. So for simplicity, I shall label the magnitude of |ZS| at ω = ∞ as 0 dB. (I could have chosen any number, of course.) Every other value of |ZS| will be expressed in dB relative to |ZS| at this frequency.
The straight-line approximation has it that |ZS| = R, all the way from infinite frequency right down to ω0. No difficulty here. What about when ω is less than ω0?
Consider |ZS| at a frequency of (ω0/10). At this frequency the slope is -1, and |ZS| is proportional to (1/ω). |ZS| here will be ten times greater than at ω = ω0. Putting this into the dB equation,
|ZS1| / |ZS2| = 20 LOG ( 10 / 1 ) = 20 dB.
The frequency has decreased by a decade, whilst the magnitude has increased by 20 dB. The slope is thus -20 dB/decade, which corresponds to a slope of -1. (The minus sign is there as a reminder that |Z| shrinks as ω rises.) Some people prefer to think of this slope as -6 dB/octave where, as musicians know, an octave means the interval between two frequencies which differ by a factor of two.
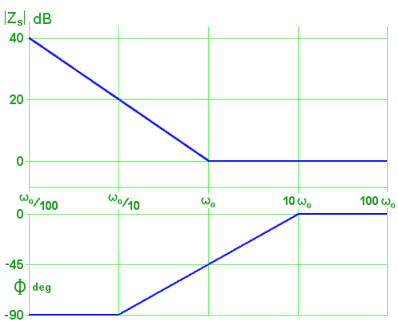
Now consider the phase graph. This is even easier, since the phase angle of (jω/ω0) is always +90°. Doing the subtraction:
- when ω << ω0, the phase becomes 0° - 90° = -90°,
- when ω >> ω0, the phase becomes 90° - 90° = 0°.
We can even add,
- when ω = ω0, the phase becomes 45° - 90° = -45°.
These straight-line approximations are sketched here. They look intuitively right.

At low frequencies, the capacitor's impedance is more important than the resistor's (because it's bigger) so magnitude is inversely proportional to frequency and phase angle is a constant -90°.
At high frequencies the capacitor becomes almost a short-circuit, leaving just the resistor, so magnitude is independent of frequency and phase angle is zero.
The key thing to remember is this: - when the impedance expression has a [1 + (jω/ω0)] on the TOP, then at the break frequency, the impedance curve breaks UPWARDS (or rotates anti-clockwise, if you like).
Actual response of series network
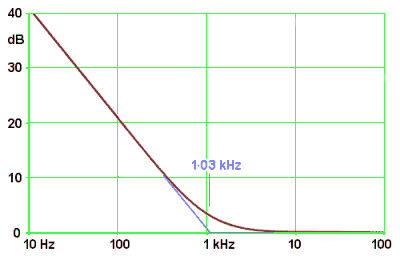

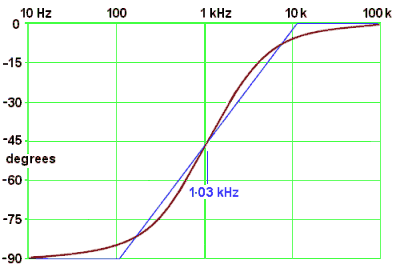
The response of a 330Ω resistor in series with a 470 nF capacitor is plotted on the right. The break frequency of this combination occurs at 1.03 kHz. I used Excel to do the sums and draw the graphs.
The curves do seem to show that the magnitude and phase responses are quite close to the straight-line approximations (shown as blue lines) that I predicted for them.
Here, 330Ω is the reference level I have used as 0 dB (the network's impedance at infinite frequency); +20 dB up from 330Ω is 3.3 kΩ, and +40 dB is 33 kΩ.
The worst-case errors are:
- for magnitude, 3 dB, at ω = ω0, and
- for phase, about 5° at ω = 3ω0 and ω0/3.
Approximate response of parallel network

The parallel circuit is just as straightforward. Its impedance is
Parallel: ZP = R / [1 + (jω/ω0)]
All I have to do here to find the magnitude response is to subtract the slope of (1 + jω/ω0) from the slope of the constant (1); that is, from 0. So:
- when ω << ω0, the slope becomes 0 - 0 = 0,
- when ω >> ω0, the slope becomes 0 - 1 = -1 = -20 dB/decade.
The magnitude when the slope is zero is just R, by the same reasoning as before. In contrast to the series network, |ZP| has a slope of 0 at frequencies below ω0.
The phase is found by subtracting the angles:
- when ω << ω0, the phase becomes 0° - 0° = 0°,
- when ω >> ω0, the phase becomes 0° - 90° = -90°,
- when ω = ω0, the phase becomes 0° - 45° = -45°.
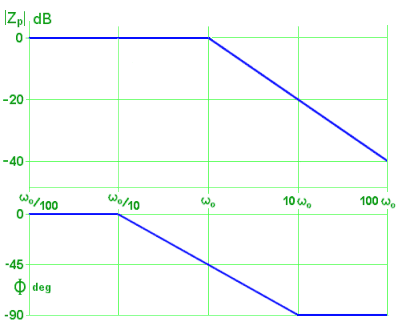
These responses are sketched here. They too look intuitively correct.
At low frequencies the impedance of the capacitor is so high it doesn't affect things, so the magnitude is R and the phase angle is zero.
Conversely at high frequencies the capacitor dominates by virtue of its much lower impedance, so the magnitude is inversely proportional to ω and the phase angle is a constant -90°.
The key thing to remember is this: - when the impedance expression has a [1 + (jω/ω0)] on the BOTTOM, then at the break frequency, the impedance curve breaks DOWNWARDS (or rotates clockwise, if you like).
Actual response of parallel network

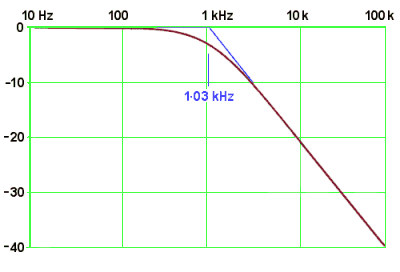
To emphasize the differently-shaped response of the parallel network, I have deliberately chosen to use the same value components as for the series network - that is, 330Ω and 470 nF. The break frequency thus remains at 1.03 kHz. Again, the blue lines show the approximation.
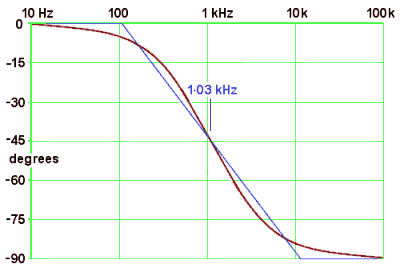
330Ω is still the reference level I have used as 0 dB (but now it's the network's impedance at zero frequency); -20 dB down from 330Ω is 33Ω,and -40 dB is 3.3Ω.
The worst-case errors are the same as for the series network:
- for magnitude, 3 dB, at ω = ω0, and
- for phase, about 5° at ω = 3ω0 and ω0/3.
Exact expressions for magnitude and phase
So far the technique of approximating the responses has allowed me to sketch the responses with a fair degree of assurance that their shape is about right. I now need the formal equations that describe their behaviour so that I can do actual sums. The algebra isn't difficult, so I will state only the results here. They are:
Series: |ZS| = R √[1 + (ω0/ω)2] . . . . . . . and Φ = arctan (- ω0/ω) degrees.
Parallel: |ZP| = R / √[1 + (ω/ω0)2] . . . . . . and Φ = arctan (- ω/ω0) degrees.
Please note that to make the equations short and simple, the (ω/ω0) term is (ω0/ω) in the Parallel equations!

Example 2.1
A 1k ohm resistor and a 100 nF capacitor are connected in series. What is the break frequency? What is the impedance magnitude and phase at 1 kHz?
The break frequency is: f0 = 1 / ( 2 * π * 103 * 100 x10-9 ) = 1.592 kHz.
At a frequency of 1 kHz, (ω/ω0) = (f /f0) = 1000/1592 = 0.628 and (ω0/ω) = 1.592
so (ω/ω0)2 = (f /f0)2 = 0.395, and (ω0/ω)2 = 2.53.
so the impedance at 1 kHz:
|Z| = 1000 x √[1 + 2.53] = 1000 * 1.88 = 1.88 kΩ, and the phase angle is
Φ = arctan [ -1.592] = -57.9°.
These answers seem sensible. |Z| is bigger than R, and Φ is nearer -90° below the break frequency.

Example 2.2
A 1k ohm resistor and a 100 nF capacitor are connected in parallel. What is the break frequency? What is the impedance magnitude and phase at 1 kHz?
The break frequency depends just on the components, not on how they are connected together. It stays at 1.592 kHz, as in Example 2.1.
The impedance at 1 kHz is:
|Z| = 1000 / √ [1 + 0.395] = 1000 / 1.181 = 847Ω, and the phase angle is:
Φ = -arctan [ -0.628] = -32.1°.
These answers make sense too. |Z| is less than R, and Φ is closer to 0 than to -90° below the break frequency.
